Monetary Debasement vs. Supply Shocks
Price inflation, being a multi-faceted phenomenon, usually has multiple causes at once, and those individual causes become relevant over different time periods.


Over the past few years, there has been considerable public debate on the topic of price inflation, where it’s coming from, and how to best get it under control.
What adds fuel to the fire is that the debate is political and is tied to people’s worldviews. For some, it’s supply chain problems and greedy corporations that are responsible for broad price increases. For others, it’s the central bank printing too much new base money. For still others, it’s the government’s stimulus programs, and if multiple administrations were involved, then it’s primarily blamed on whichever administration they don’t like.
Price inflation, being a multi-faceted phenomenon, usually has multiple causes at once, and those individual causes become relevant over different time periods. This makes it so that most explanations do have a grain of truth to them, and a chart can be made up to make any explanation seem true by focusing on the narrow aspect for which it might actually be true.
At the end of the day, price inflation comes from too much money chasing too few goods and services. In a cyclical sense, improvements or losses in productivity, wars, supply chain problems, labor market constraints, and commodity supply constraints can result in higher or lower prices temporarily. In a structural sense, however, it’s the increase in the money supply and long-term changes in productivity that drive aggregate price levels.
This article looks at both monetary debasement and supply shocks to quantify some of the impacts between the two.
Temporary price shocks with a specific catalyst (e.g. a shortage of a specific metal in a war, or a shortage of hand sanitizer in a pandemic) will retrace back to their pre-war price when the catalyst is over. These price increases aren’t primarily from new money creation; they’re from a temporary surge in demand or a temporary reduction in supply.
On the other hand, if substantial new money creation is what primarily drove price increases in aggregate, then even after certain catalysts are finished, the equilibrium of most prices will remain permanently higher going forward, because the unit of currency that they are measured in has been permanently debased.
We can apply to that test to each of the major inflationary periods of modern U.S. history (the 1910s, 1940s, 1970s, and the present).
1910s Inflation
The second half of the 1910s decade was defined by World War I. And then as the war ended, the Spanish Flu also took its toll.
When we look at price changes in rate-of-change terms (top panel below), the war seemed to be incredibly inflationary, followed by a post-war period of deflation, and then stable prices with no more inflation or deflation for a while. At first glance, this seems to suggest that price increases were temporary. However, when we look at the aggregate price levels in absolute terms (bottom panel below), we see that the inflationary period was much bigger than the deflationary period, resulting in post-war prices that averaged nearly 75% higher than the pre-war period.


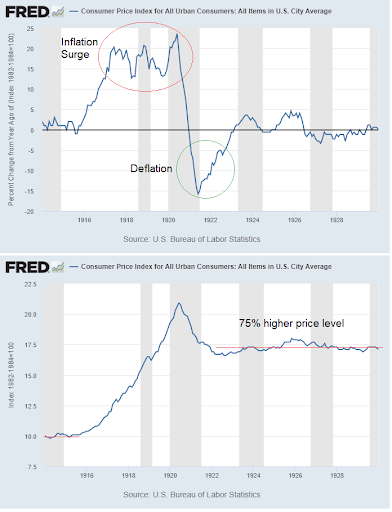
Plenty of new money was created to fund the war, and prices became permanently higher as a result after some of the temporary excesses and problems wore off.
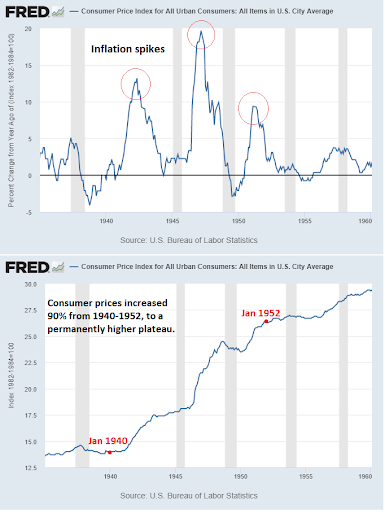
For the 1940s inflation spike, we see a similar outcome.
There were waves of temporary inflation in rate-of-change terms, but prices eventually settled at a structurally higher level due to the substantial amount of new money creation that occurred throughout the period:


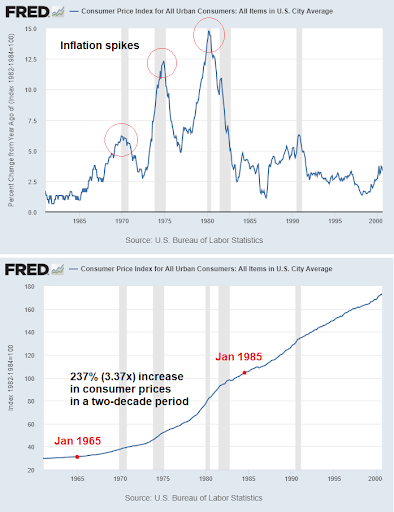
In the 1970s we see the same thing again.
Oil supply shocks and war led to temporary spikes of inflation, which eventually subsided. However, prices settled at permanently higher levels, and then continued growing from there, because a burst of credit creation led to a considerable amount of additional money existing in the system:


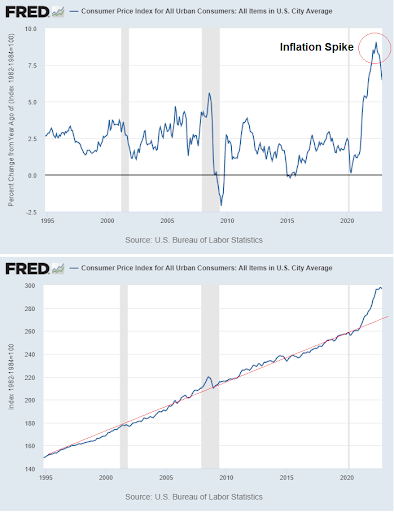
The full 2020s story has yet to be written, but so far is playing out the same way. Prices march consistently higher, and with the latest surge of money creation during 2020 and 2021, we may have broken out from the prior trend:

Back in 1913, the price for a barrel of oil was $0.95. Today it is $79.
Also in 1913, one gold ounce could buy you 22 barrels of oil. Today, one gold ounce can buy you 24 barrels of oil. In other words, oil priced in gold has been basically flat over the past 110 years. It just had volatile ups and downs along the way due to wars, recessions, and other things. Oil priced in dollars had similar ups and downs, but also had a 4.5% annualized upward price trend that compounded over the course of a century.
In 1913, the broad money supply (M2) was $19 billion. Today it is over $21 trillion, which is more than a thousand-fold increase. The population was about 97 million in 1913 and is about 332 million today, so that’s a 3.4x increase. Putting this together, in 1913 there were 196 dollars of broad money per American resident, while in 2022 there were 63,800 dollars of broad money per American resident. This is a 325x increase in the amount of broad money per resident.
Sign up to start saving Bitcoin
Buy automatically every day, week, or month, starting with as little as $10.
Fortunately, improvements in productivity (technology) have prevented most prices from rising by 325x. They’ve instead risen more like 80x-120x for relatively scarce things (oil, meat, gold, and things like that). They’ve risen much less than that for things that we got way better at making as a society that aren’t really scarce at all, such as grains and electronics. The things that have truly risen 325x or more in price tend to be the scarcest things of all, like waterfront properties or fine art from famous deceased artists.
If money creation is the primary driver of structural price increases (with the other being changes in productivity and other details around resource demand and supply), then we really need to know what specifically is causing money supply to rise or fall if we are to judge whether a given decade is likely to have above-trend or below-trend inflation.
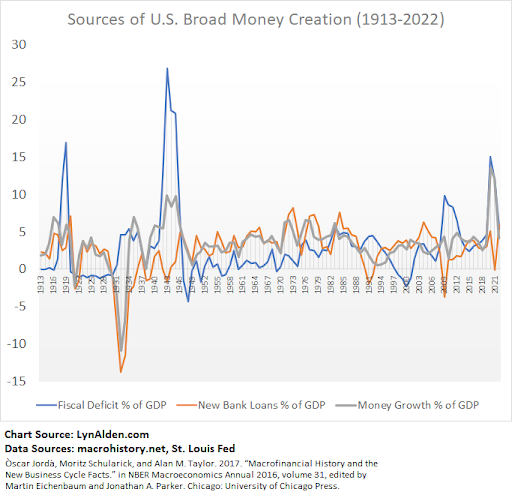
In my November 2020 article “Banks, QE, and Money-Printing“, I discussed in detail how both base money and broad money are created or destroyed in a fiat financial system. The summary is that base money is mainly created or destroyed by central bank activity, and broad money is mainly created either from 1) bank lending or 2) fiscal deficits. When it comes to consumer price inflation, broad money is what we mainly care about.
Here in 2023, we have some updated data.
This chart shows the year-over-year percentage change in three numbers. The first number in blue is the fiscal deficit as a percentage of GDP. The second number in orange is the amount of new bank loans as a percentage of GDP. The third number, bolded in gray, is the amount of new broad money as a percentage of GDP:


That chart is a bit messy, so here is a version that uses a rolling 3-year average to reduce noise, and zooms in a bit:

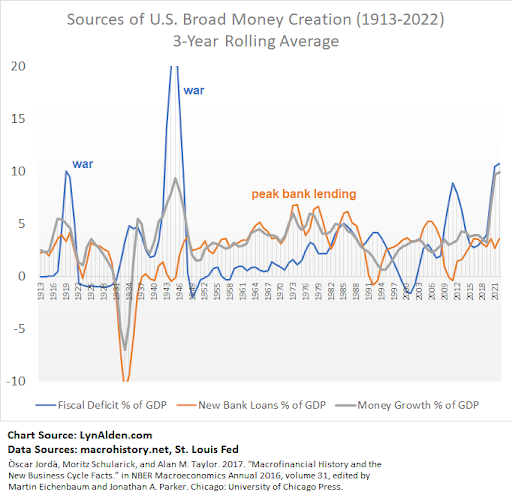
During World War I (1910s), U.S. bank lending first had an uptick in order to finance allies like the United Kingdom without getting involved directly. And then by the end, the U.S. got involved directly, and fiscal deficits spiked. Both of these aspects caused an uptick in money creation.
During the Great Depression (1930s), a significant amount of broad money was destroyed as bad loans were defaulted on and banks failed. There was an uptick in fiscal spending, but it was smaller than the amount of loan losses, and so money supply went down and price inflation was negative.
During World War II (1940s), the rate of new money creation spiked due to war-related fiscal spending. There was not much bank lending during this time. Broad money was created in spite of banks and went around banks. The post-war years generally saw temporary fiscal austerity (surplus), and this contributed to a post-war recession as the economy digested what had happened and shifted back to a more normal baseline.
During the 1970s, the baby boomer generation (the first of which were born in the late 1940s) began reaching their mid-20s homebuying years. This demographics surge caused a big uptick in demand for goods and services, and especially energy. While some money was created through deficit spending (the Vietnam War and Great Society programs), the majority of it was created via bank lending. A demographics-led boom in credit creation fueled a boom in consumption.
During the Great Recession (2008 and into the early 2010s), there was negative loan creation due to widespread defaults, and an approximately equal amount of money creation from fiscal stimulus and bailouts. The result was generally neutral for the money supply and prices, like a less intense version of the Great Depression.
During the COVID-19 shock and the first half of the 2020s decade thus far, the situation has been similar to the early 1940s. There was a huge spike in money creation due to large fiscal stimulus, while bank lending was normal.
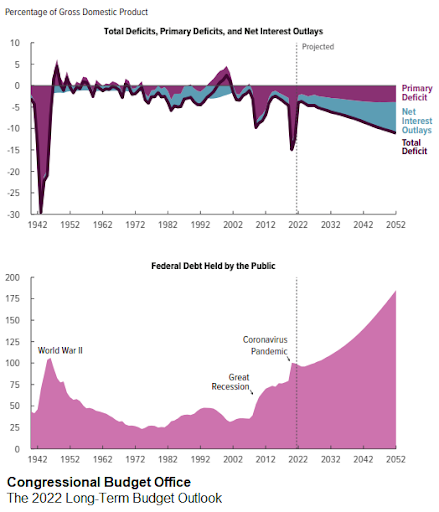
However, unlike the 1940s, the U.S. government today is set to run $1+ trillion fiscal deficits for the foreseeable future due to top-heavy entitlement programs and persistently large military spending. Moreover, the highly-financialized economy relies on ever-higher asset prices in order to fuel ever-higher tax revenue, and so even attempts at fiscal austerity would have a tough time reining in deficits at this point.


As described above, price inflation can accelerate or decelerate for a variety of reasons. The rate of money creation, either primarily from fiscal spending (e.g. 1940s and 2020s) or primarily from bank lending (e.g. 1970s) plays a big role in structural price increases over time. In the current financial system, both the base money and broad money increase in supply over time. Around the margins, surges of demand or impairments to supply can affect inflation significantly in the cyclical sense.
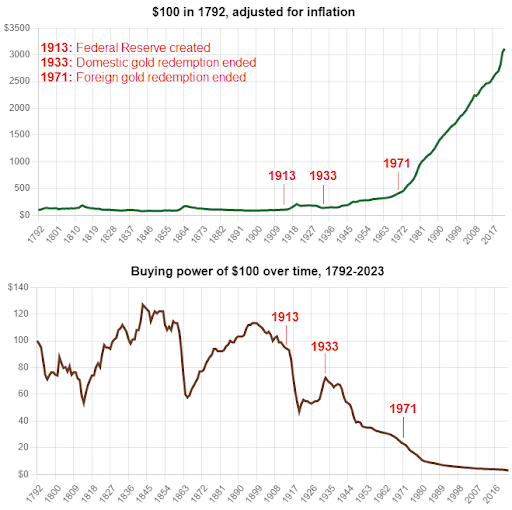
The more we zoom out, the changing nature of how money is defined and maintained at the national and global level plays a big role in determining whether the units that we use hold their value over time or not. This chart shows the purchasing power of the U.S. dollar since its creation in 1792, with dates of major definition changes annotated:


Ian Webster
From 1792 until 1913, the purchasing power of the dollar fluctuated in a sideways manner, with no estimated loss of purchasing power overall. It was defined as a fixed amount of gold. During the War of 1812 and then again during the Civil War in the 1860s, there were bursts of inflation but they were ultimately temporary, with deflation in the aftermath that brought prices back in line with the pre-war baseline.
The Federal Reserve was created in 1913, which marked a change in how the country handles its base money, and how it handles its monetary policy more broadly. The redeemability of dollars for gold domestically was ended in 1933, and Americans were disallowed from owning gold under threat of imprisonment for the next four decades. The redeemability of dollars for gold for international creditors was then ended in 1971.
This process represented a gradual decoupling between the process of currency creation and any sort of tether to physical constraints or supply limits, and so naturally that currency creation process accelerated and hasn’t looked back since.
Sometimes there are big disinflationary offsets that conceal the impact of this constant money creation, such as the rapid globalization of the 1990s through the 2010s, where a tremendous untapped labor pool in China end elsewhere was plugged into western capital markets and corporations, which kept prices and wages down broadly. Other times, such as in recent years, there are insufficient disinflationary offsets to conceal the ongoing money creation or certain crises that can accelerate the pace of money creation, and we begin to feel it more.
Sign up to start saving Bitcoin
Buy automatically every day, week, or month, starting with as little as $10.
Lyn Alden
Lyn is an investment strategist at Lyn Alden Investment Strategy. She holds bachelor’s degree in electrical engineering and a master’s degree in engineering management, with a focus on engineering economics and financial modeling. Lyn has been performing investment research for over fifteen years in various public and private capacities.
More from Swan Signal Blog
Thoughts on Bitcoin from the Swan team and friends.


Running the Numbers: How Fiat Pushed the American Dream Away from Millennials


Bitcoin symbolizes hope for a generation who increasingly feel as though their futures have been stolen from them by the traditional fiat system.


Best Bitcoin ETF Fees: Lowest to Highest (May 2024)


In this guide, we analyze and present the top 10 Bitcoin ETFs with the lowest fees for cost-effective investing.


Privacy, Executive Order 6102 & Bitcoin


Let’s keep pushing forward for the future we want to see, one in which both the price of Bitcoin and global freedom can go up together.